
From Raw Data to Results: The RNA-Seq Workflow
A step-by-step guide to transforming sequencing reads into biological insight
RNA-Seq is one of the most powerful tools for transcriptomic profiling and measuring gene activity across thousands of genes simultaneously. But meaningful discoveries do not emerge automatically. Between raw sequencing files and biological conclusions lies a structured analytical workflow — and each step determines whether you capture real biology or technical noise.
Understanding this pipeline isn’t just for bioinformaticians. It shapes how experiments are designed, how results are interpreted, and whether findings stand up to replication.
In Part 1, we saw how RNA-Seq uncovered hidden immune patterns in COVID-19 patients—patterns that explained disease severity in ways standard diagnostics could not. That discovery was compelling, but it didn’t emerge by chance. It came from a defined analytical process — the same workflow that underlies every RNA-Seq study.
This article opens up that workflow. How do millions of RNA fragments become interpretable biological insight? How does raw sequencing data become the discoveries that drive research forward?
The answer lies in a five-stage process—the same workflow used in every RNA-Seq study, whether investigating rare disease, cancer biology, or drug response.
Let's walk through how it works.
The RNA-Seq Workflow at a Glance
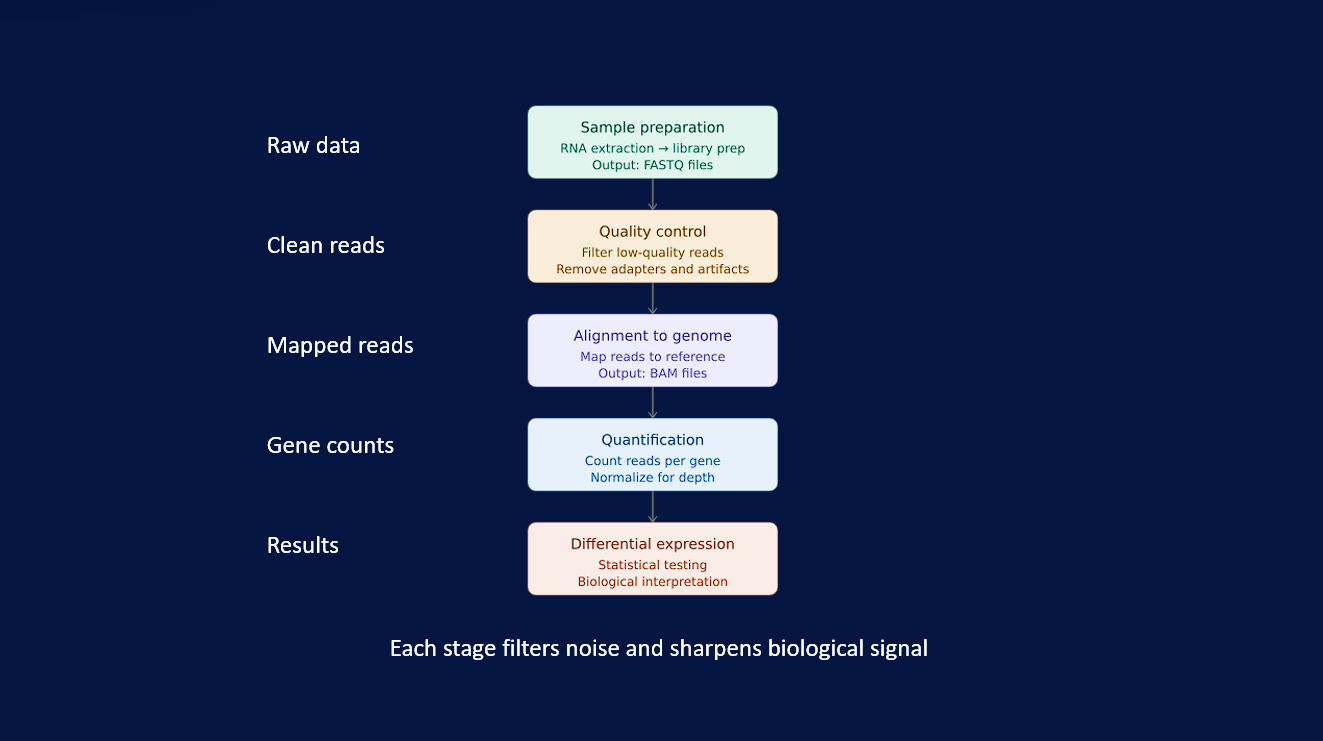
Stage 1: Sample Preparation & Sequencing
Everything starts with biology.
RNA is extracted from cells or tissue and converted into a sequencing library. Because RNA reflects the current functional state of a cell, its integrity matters — degraded RNA can distort downstream measurements.
High-throughput sequencing then reads millions of RNA fragments, producing raw data files known as FASTQ files. Each file contains the nucleotide sequence of each read and a quality score for every base
At this point, you have massive amounts of data — but no biological meaning yet. The sequences are simply fragments without context.
Stage 2: Quality Control of Raw Reads
Before analysis, confirm one thing: is the data usable?
Sequencing reads often contain technical artifacts—low-quality bases at read ends, adapter contamination from library preparation, and amplification bias.
Quality control identifies these issues and removes problematic reads or bases. Tools like FastQC examine raw reads to check for low quality scores, adapter contamination, overrepresented sequences, and unexpected GC content patterns.
Why this matters: Low-quality data doesn't just add noise—it actively distorts downstream analysis, leading to false positives or missed signals.
Stage 3: Alignment or Transcript Quantification
Next, reads are assigned to genes.
In traditional workflows, tools like STAR or HISAT2 align reads to a reference genome, producing BAM files that record where each read maps. Newer approaches such as Salmon quantify reads directly against known transcripts without full alignment.
Regardless of the method, the goal is the same: determine how many reads belong to each gene.
The output of this stage is a raw count matrix — genes in rows, samples in columns — still influenced by technical variation, but now structured for biological analysis.
Stage 4: Normalization
Raw counts can’t be compared directly between samples.
Differences in sequencing depth or RNA composition can create artificial shifts in expression — a sample with more total reads will naturally show higher counts, even if the biology is identical.
Normalization corrects for these effects, ensuring differences reflect biology rather than technical variation.
Common approaches include TPM (depth and gene-length adjusted) and DESeq2/edgeR methods, which preserve count structure for statistical testing. Now comparisons between conditions become meaningful.
After normalization, you have a gene expression matrix—rows are genes, columns are samples, values are normalized expression levels. This is the foundation for all downstream analysis.
Stage 5: Differential Expression & Biological Interpretation
With normalized data in hand, statistical models identify genes that differ significantly between conditions.
The output is a results table containing:
Fold change (how much expression increased or decreased)
Adjusted p-value (controlling for false discoveries)
Together, these determine which genes are considered differentially expressed.
But a gene list is only the starting point.
To extract meaning, differentially expressed genes are mapped onto biological pathways and functional categories. This reveals whether changes cluster in processes such as immune response, metabolism, or cell cycle regulation.
This is the stage where sequencing data becomes biological insight — and where context and domain knowledge determine whether findings represent real mechanisms or statistical artifacts.
When the Workflow Breaks
This is where most issues actually occur in practice.
Mistakes at any stage propagate downstream.
Batch effects can masquerade as biological signal.
Genome version mismatches can systematically distort gene counts.
Skipped quality control can inflate false discoveries.
Too few replicates can generate results that fail validation.
Most irreproducible RNA-Seq findings don’t come from bad biology. They come from weak workflow decisions.
Understanding the pipeline helps you recognize these risks — and prevent them before they reach publication.
From Workflow to Insight
The RNA-Seq workflow transforms biological samples into insight through structured steps. Each stage filters noise and sharpens signal until meaningful differences emerge.
Historically, executing this workflow required command-line expertise and stitching together multiple tools. Modern platforms such as aimed analytics streamline the process from count matrices onward—handling normalization, statistical testing, and visualization without requiring coding expertise. This lets researchers focus on biology rather than debugging pipelines.
👉Book a demo to analyze RNA-Seq data without coding on the aimed analytics platform
What Comes Next
This article covered how RNA-Seq moves from raw data to statistical results. You now understand the pipeline stages and why each matters.
Our next article opens the curtain on what results actually look like:
Volcano plots that separate signal from noise
Heatmaps showing sample clustering and outliers
Pathway enrichment connecting genes to biology
Gene-level views verifying top hits
Interactive tools (iDEP and aimed analytics) for exploration
This is where raw data finally becomes interpretable biology — and where analysis starts to drive real insight.